How to Speed Up Your Website by Waterfall Analysis
Website loading performance is the core of business performance and growth. If you are experiencing a high drift of visitors, poor loading performance of web pages may be a major cause. You might be using website load time measuring tools like Google PSI Tool – PageSpeed Insights, WebPageTest,or GTmetrix, etc; these can generate Waterfall charts but might not be using this less-known but very important feature. Unless you understand real-time website performance insights, it is a tough task to find the particular silo and eradicate it. Understanding Waterfall analysis charts or Waterfall analysis graphs helps you optimize website loading performance at ease based on real-time metrics. Read this blog to understand what is ‘Waterfall analysis’ and ‘how to use Waterfall analysis layouts/charts to keep your business website performing in retaining visitors’.
What is Waterfall analysis?
Waterfall analysis is an analytical method used to monitor, scale, and analyze a website’s performance. Waterfall analysis is a methodology for analyzing the requests and responses between a server and a client to get real-time insights into website loading patterns. Waterfall analysis helps you identify the particular resources causing the slow loading of websites like large images or non-optimized JavaScript files. The waterfall charts or waterfall graphs are the visual representation of order and how the different website assets like CSS, JavaScript, images, plugins, third-party content, HTML, etc load.
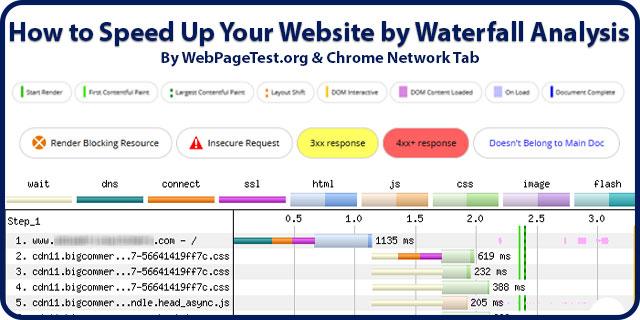
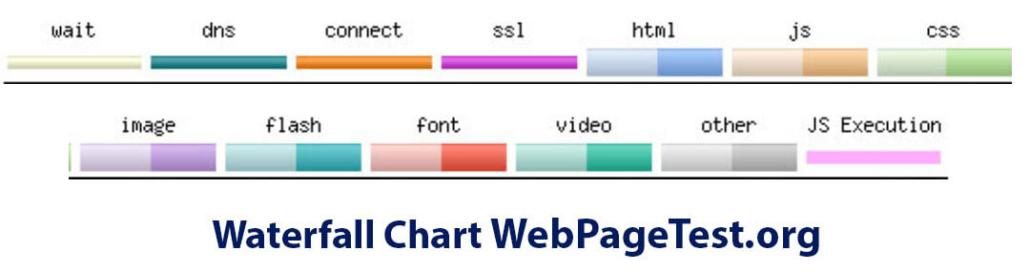
How to Understand Waterfall Analysis Chart by Colors in WebPageTest.org Tool
Each row in the Waterfall analysis chart represents a different object within a page like text, an image, a JavaScript file, etc. Each object travels between the server and browser; the captured journey time for each activity reflects in a waterfall chart in a different colored bar.
Waterfall Analysis Attributes
Different Waterfall tools create different Waterfall charts with variations in lines, bars, colors. Waterfall charts can be created for more purposes than just evaluating total load time of web pages. Depending on the tool that you use, the names for some attributes may vary slightly. The key attributes of the Waterfall chart are elaborated below.
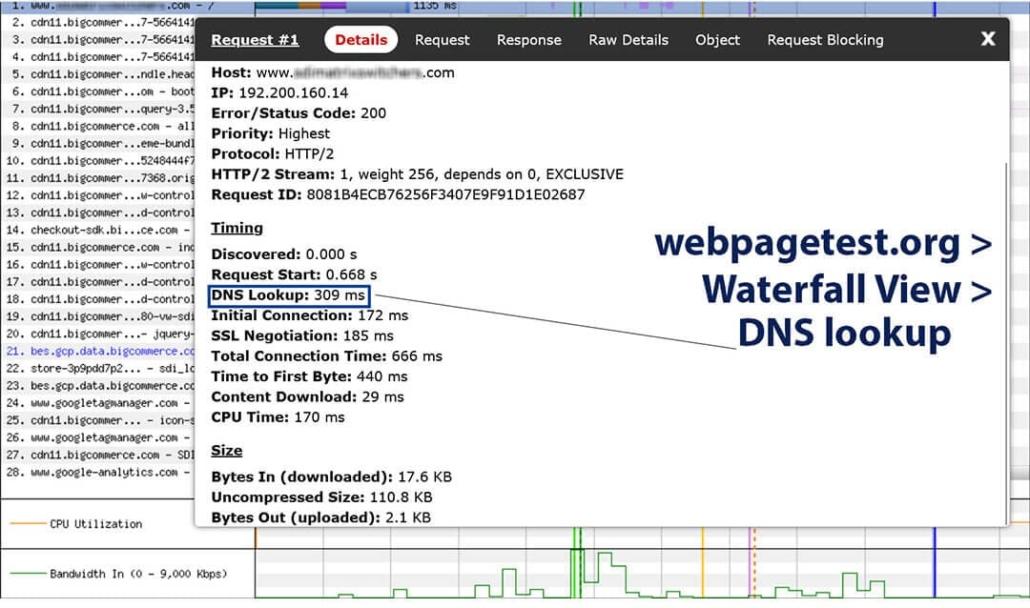
DNS lookup
A DNS lookup or DNS record lookup is a process of converting human-readable domain names into a computer-readable IP address (216.168. 246.55). A DNS lookup is initiated each time a URL is entered into the browser’s address bar.
How can you faster DNS lookup?
Faster DNS lookup can be achieved by using a combination of strategies:-
- Employ a reputable DNS server, like Free Google DNS Service or Google Cloud DNS or Cloudflare DNS Free & Paid Service with Security, reliability and speed .
- Cache DNS responses locally to avoid repeated queries.
- Reduce TTL values for faster cache updates.
- Implement DNSSEC validation judiciously to balance security and speed.
- Employ a content delivery network (CDN) to distribute DNS resolution load. Utilize anycast routing to direct queries to the nearest DNS server.
- Hosting third-party assets on your CDN minimizes the requests to a single DNS lookup.
- Applying DNS prefetching improves the DNS lookup process by allowing the browser to perform DNS lookups in the background during browsing.
- Regularly monitor and optimize your network’s DNS infrastructure for optimal performance.
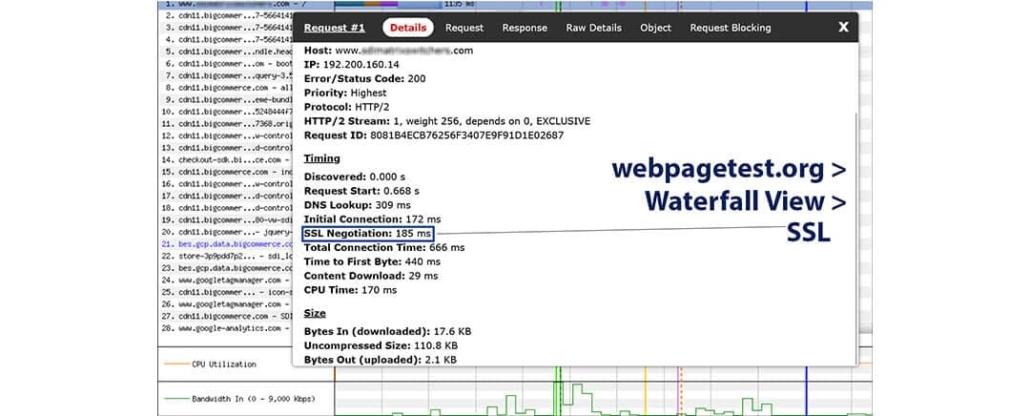
SSL / TLS
Also called SSL negotiation, it is the time taken by the web browser to perform an SSL/TLS handshake. You will see SSL / TLS only if your website or CDN is running over HTTPS.
How can you improve SSL / TLS time?
To enhance SSL/TLS performance, consider these steps:
- The use of HTTP Strict Transport Security (HSTS) improves website performance by eliminating unnecessary HTTP-to-HTTPS redirects.
- Opt for modern TLS versions (e.g., TLS 1.3) with faster handshakes.
- Utilize hardware-accelerated encryption/decryption to offload processing.
- Implement session resumption to reduce handshake overhead.
- Use elliptic curve cryptography (ECC) for quicker key exchange.
- Employ OCSP stapling to avoid time-consuming certificate checks.
- Reduce the number of round-trips by consolidating resources or enabling HTTP/2.
- Regularly update SSL/TLS libraries for performance enhancements.
- Prioritize ciphersuites with better speed-to-security ratios.
- Employ a Content Delivery Network (CDN) with optimized SSL/TLS handling.
- Regularly benchmark and tweak configurations based on evolving best practices.
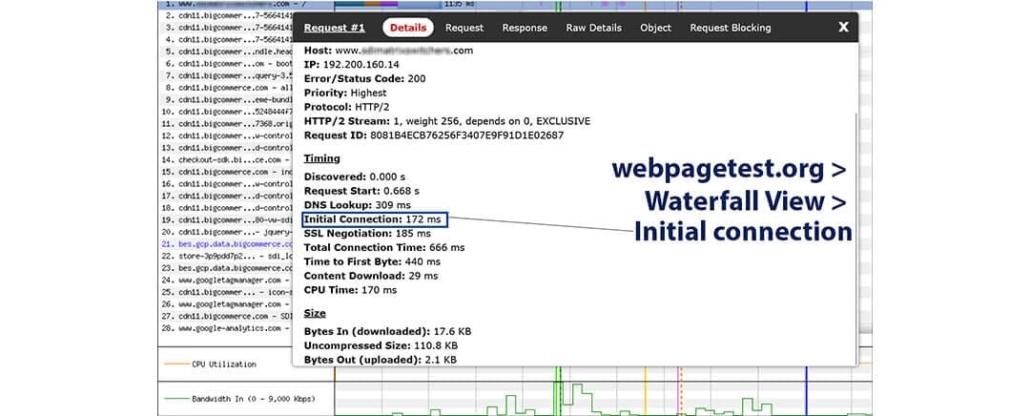
Initial Connection / Connect / TCP Connection
Also termed as the TCP connection or connect, it is the time required for creating a TCP connection. It creates a connection between a server local host/client.
How can you minimize initial connection time?
Minimizing initial connection time involves several strategies:-
- Choose a high-performance web hosting service with low server response times.
- Optimize front-end code, reduce HTTP requests, and employ asynchronous loading.
- Utilize a Content Delivery Network (CDN) to distribute content across multiple servers closer to users.
- Implement browser caching to store static assets locally and reduce reload times.
- Enable HTTP/2 to multiplex requests and responses for quicker loading.
- Compress resources and use GZIP to reduce data transfer sizes.
- Minimize third-party scripts and prioritize critical rendering pathways.
- Finally, employ server-side caching mechanisms and consider preconnect/preload techniques to reduce DNS lookup and establish connections earlier.
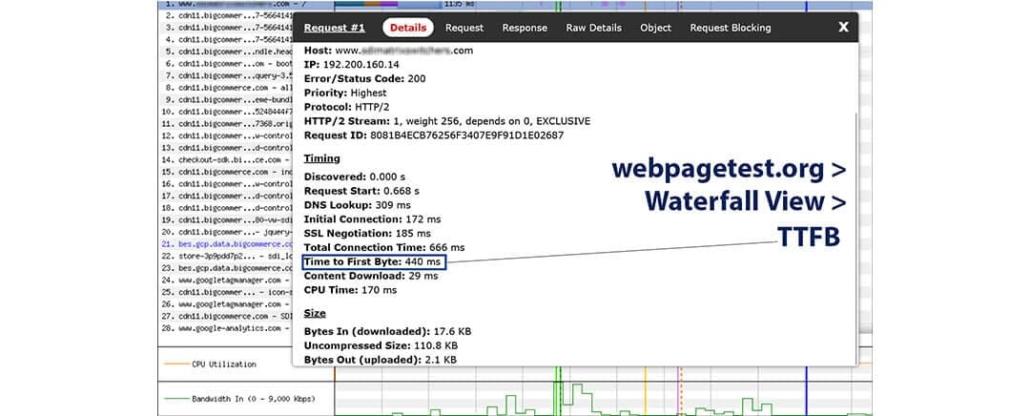
TTFB Waiting
Time To First Byte (TTFB) is the time between HTTP request creation and receiving its first byte from the web server. Faster TTFB means that the requested resource will be delivered to the browser faster.
How can you improve website speed by reducing TTFB waiting time?
To enhance website speed by reducing Time To First Byte (TTFB) waiting time, follow these steps:-
- Opt for a high-performance web hosting provider.
- Implement server-side caching and content delivery networks (CDNs) to store and deliver content more efficiently.
- Optimize database queries and use indexing for faster data retrieval. Minimize unnecessary plugins and scripts.
- Enable GZIP compression to reduce data transfer time.
- Utilize a reverse proxy or caching mechanism like Varnish.
- Optimize server configurations, such as using opcode caching for PHP.
- Finally, consider using a faster DNS provider and ensuring efficient SSL/TLS handshake protocols for secure connections.
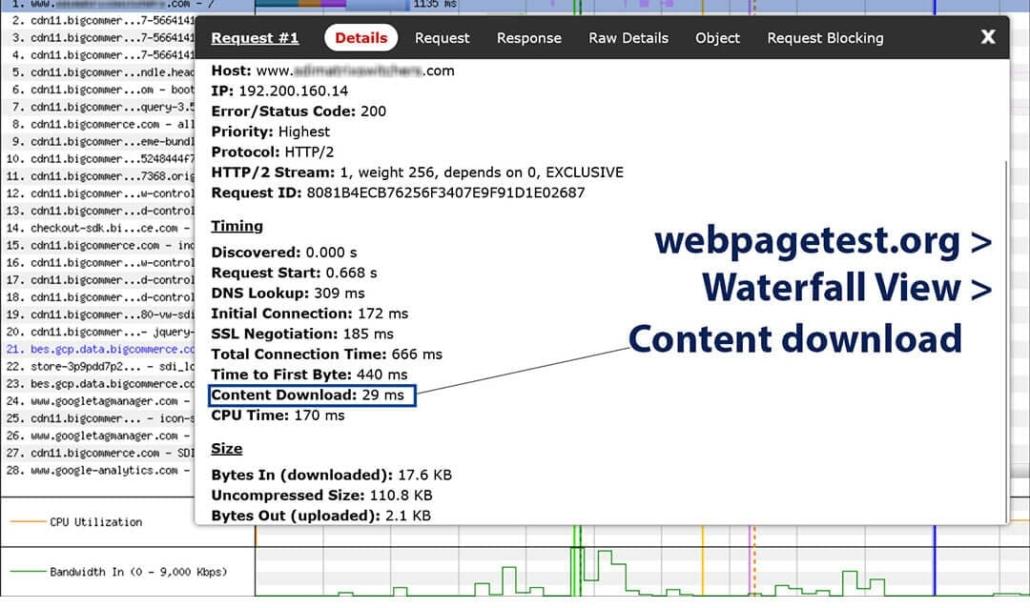
Content Download
It is the time taken to download requested content. The larger size assets and file sizes cause longer Content download time. Image compression is an effective practice to reduce the content download time.
How can you speed up content download?
To accelerate content download, employ these strategies:-
- Compress images and resources using modern formats like WebP.
- Leverage browser caching for reusable elements.
- Reduce TCP connection time.
- Preconnect to allow the browser for early connections prior to HTTP requests being sent to the server
- Enable GZIP compression on the server to reduce data size. Utilize a Content Delivery Network (CDN) to serve content from geographically distributed servers.
- Minify CSS, JavaScript, and HTML to reduce file sizes.
- Prioritize critical content with techniques like lazy loading and asynchronous loading.
- Implement HTTP/2 to multiplex requests and responses.
- Optimize server response times by streamlining code and database queries.
- Regularly monitor and fine-tune these optimizations for consistent speed improvements.
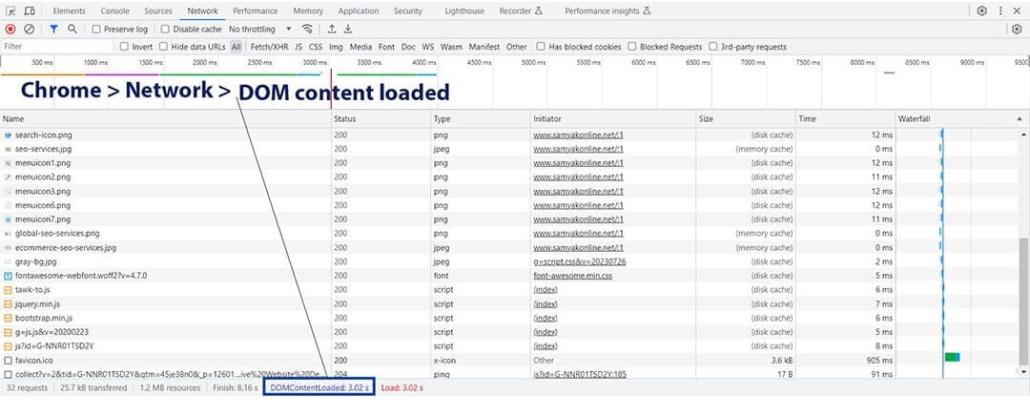
DOMContentLoaded (DCL)
It is the time taken by the browser at the site’s server to parse a document and execute deferred and parser-inserted scripts after the users’ request.
How can you improve website speed by reducing DOM Content Loaded time?
To decrease DOM Content Loaded time and enhance website speed, adhere to these practices:-
- Minimize and defer JavaScript execution by placing scripts at the end of the body or using the async and defer attributes.
- Trim down CSS and inline critical styles for swift rendering.
- Optimizing web fonts and using system fonts
- Reduce the number of third-party scripts and opt for asynchronous loading.
- Employ lazy loading for images and offscreen resources.
- Streamline and optimize code to minimize redundant calculations.
- Limit DOM depth and complexity to expedite parsing.
- Implement server-side rendering (SSR) for initial content display.
- Continuously monitor and optimize these techniques to ensure improved DOM Content Loaded times.
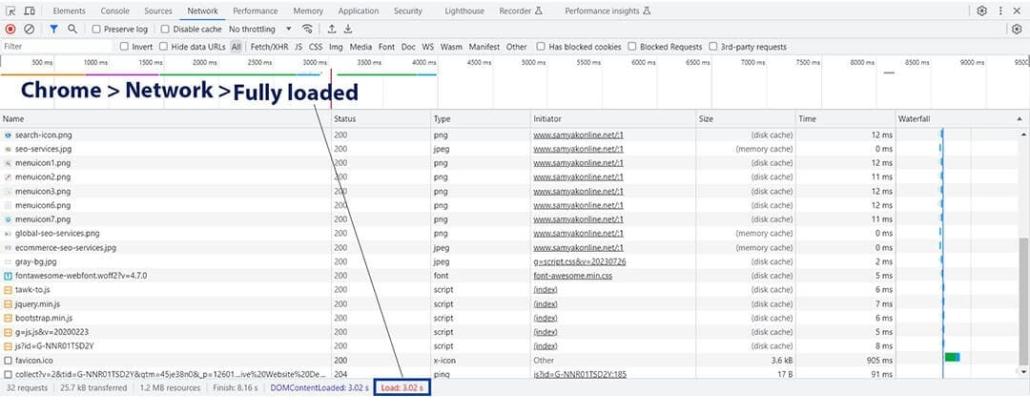
Load time / Fully loaded
Load time is an important metric. Fully loaded is the time taken by a webpage to finish downloading, rendering, and be visible to the visitor. We have already discussed the various techniques and steps to achieve ideal load time for a website. The blog – 10 Tips to Improve Website Speed for the Ultimate UX in A Smart Way. provides insights as How can you improve website speed by reducing Load time?
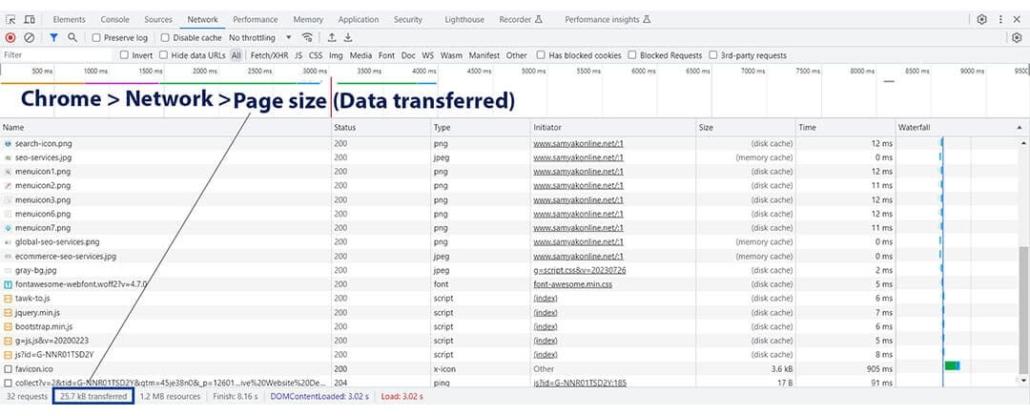
Page size / Data Transferred
Google recommends aiming for an ideal web page size of 500 KB or less for optimal performance. This includes all resources like HTML, CSS, JavaScript, images, and other assets. However, the focus should be on reducing the number of bytes transferred, which has a greater impact on load times than the specific page size. Employing techniques like minifying code, compressing images, leveraging browser caching, and optimizing critical rendering can significantly decrease the data transferred, resulting in faster loading times and an improved user experience. Regular performance monitoring and testing are crucial to ensure that your website meets these goals.
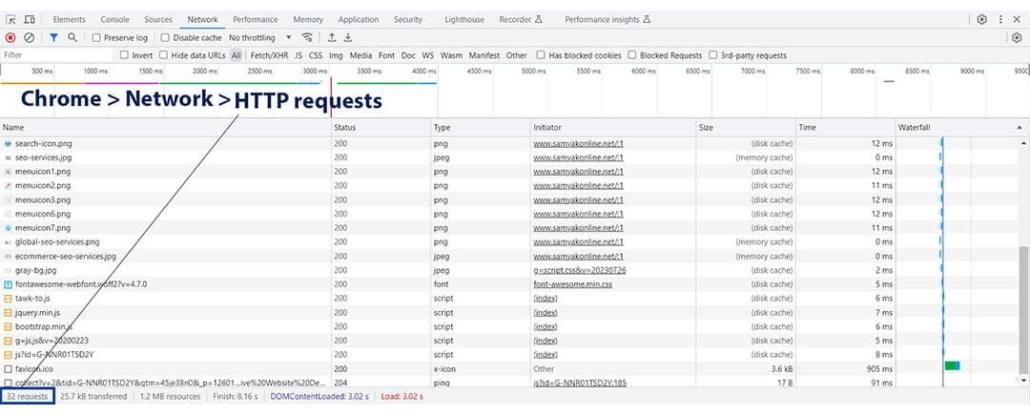
HTTP Requests
Reducing the number of HTTP requests helps minimize load times by decreasing the round-trip time between the browser and the server. Techniques like combining multiple CSS and JavaScript files, using CSS sprites for icons, and employing inline styles and scripts can help reduce the number of requests. Additionally, utilizing HTTP/2’s multiplexing capabilities can help mitigate the impact of multiple requests by allowing them to be sent over a single connection, further improving page load times and user experience.
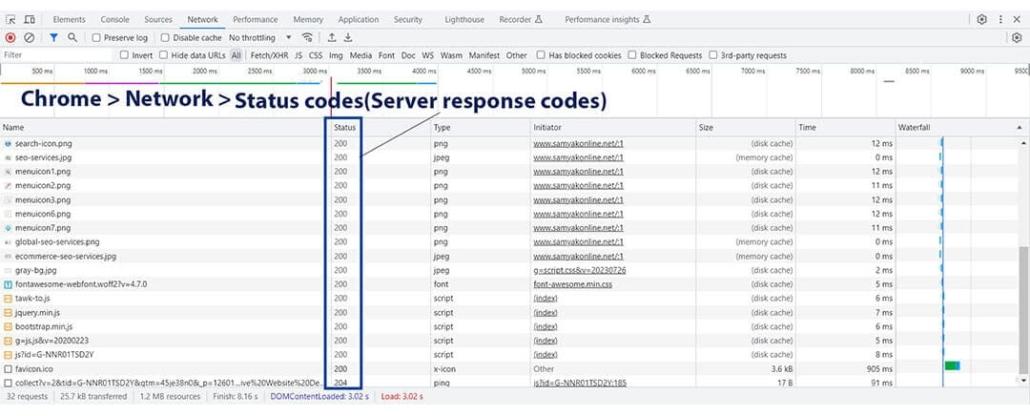
Status Codes / Error Codes
These are messages that contain request completion status information. If there is any issue with an HTTP request, you will see a list of Status codes like 400 Bad Requests, 403 Forbidden, 404 Not Found, 405 Method Not Allowed, 451 Unavailable For Legal Reasons, etc.
How can you eliminate website status error codes?
Eliminating website status error codes requires diligent monitoring, optimization, and error handling. Follow these steps:-
Regular Monitoring: Employ website monitoring tools to detect errors promptly and receive alerts when issues arise.
Optimize Server Infrastructure: Ensure your web server is properly configured and capable of handling traffic. Use load balancing and failover mechanisms to minimize downtime.
Effective Error Handling: Customize error pages to provide useful information to users. Utilize HTTP error codes to communicate specific issues (e.g., 404 for not found, 500 for internal server error).
Check External Resources: Ensure third-party resources like APIs and external scripts are reliable and properly integrated.
Security Measures: Implement security measures like input validation and user authentication to prevent attacks that might trigger errors.
Robust Code: Develop and maintain clean, efficient code that minimizes bugs and potential error triggers.
Regular Testing: Continuously test your website, including edge cases, to identify and address potential error scenarios.
Backup and Recovery: Have backups of your website and databases in case errors lead to data loss. Implement disaster recovery plans.
Content Delivery Networks (CDNs): Use CDNs to distribute content across multiple servers, reducing the impact of server-related errors.
Update Dependencies: Keep software, plugins, and frameworks updated to ensure compatibility and security.
Redundancy: Consider redundant server setups and failover mechanisms to minimize the impact of server failures.
Performance Optimization: Optimize your website’s performance to prevent overload and reduce the chances of server errors.
Implement Retry Logic: For transient errors, like network timeouts, consider implementing retry mechanisms.
Log Analysis: Regularly analyze error logs to identify patterns and root causes. This can help you proactively address issues.
User-Friendly Messaging: Craft error messages that provide clear instructions for users to resolve issues or contact support.
Ideal Major Metrics / KPIs for Website Speed
You should follow & keep optimized these major KPIs for Website Speed:-
 DNS lookup: 20 and 120 milliseconds GTMetrix
- Time To First Byte – TTFB:
Anything under ≤ 0.8s is fantastic.
Anything between 0.8s – 1.8s needs improvement,
Anything > 1.8 s is poor & must be examined - Total load time: 966 milliseconds
- HTTP requests: The fewer number of requests, the better it will be for speed
- DOMContentLoaded: 1000ms – 2000ms
- Total Download Size: 500KB
- Start render time: < 750 milliseconds
Waterfall Analysis Tools: Chrome DevTools Network & Webpagetest
There are number of Waterfall Analysis tools; the top two most used Waterfall Analysis tools are-
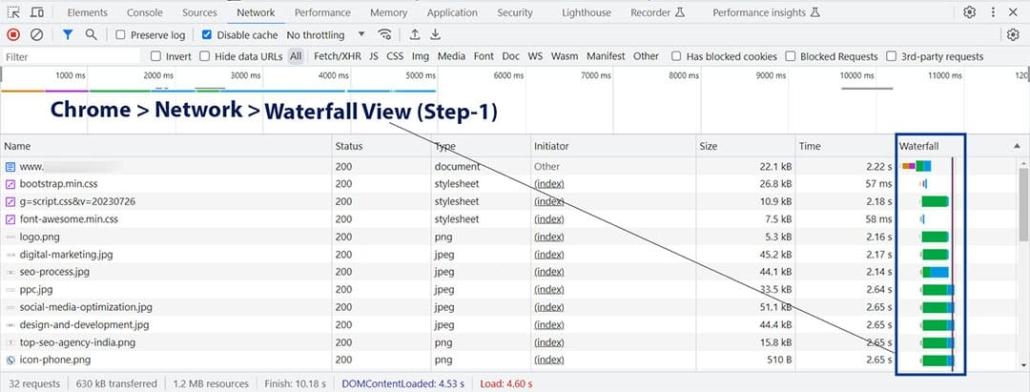
Chrome DevTools Network Tab
It provides detailed information about the issues slowing down your website speed as well as it provides metrics-driven insights to make your website faster.
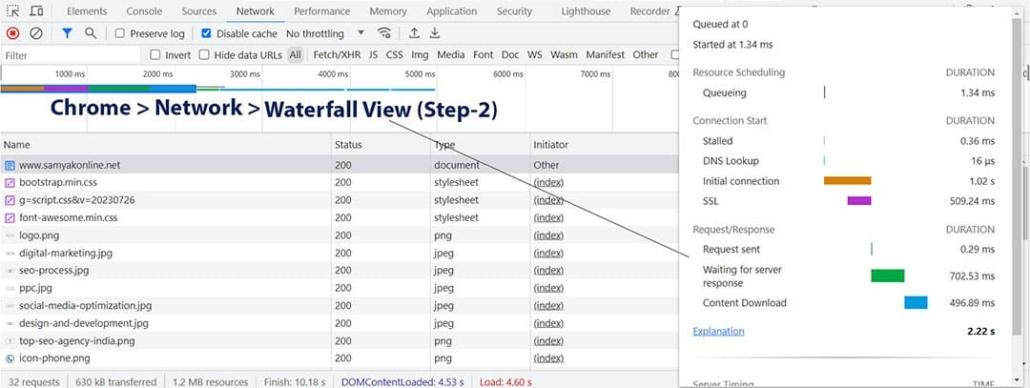
To start with, select the ‘Performance tab’ to click at ‘Start profiling and reload page’ button. Orange colored CPU timeline indicated use of a lot of JavaScript; optimize it. If you see a slow request, break down the duration of a request over the Waterfall column to find and resolve the issue. If a response is taking too long time to download, the response body needs to be smaller by different practices like image compression, image resizing, JavaScript code minimization, removing large dependencies, etc. To resolve the slow server response, look at the backend code and optimize it. Chrome DevTools has a ‘network throttling’ option to help you monitor your page render gradually and content display order with an eye upon the particular block rendering. To improve the load experience for the users, clear Chrome’s DNS and connection caches. Other features of Chrome DevTools Network Tab are Filmstrip, Group by frame, Request columns, Connection India, Initiator, etc.
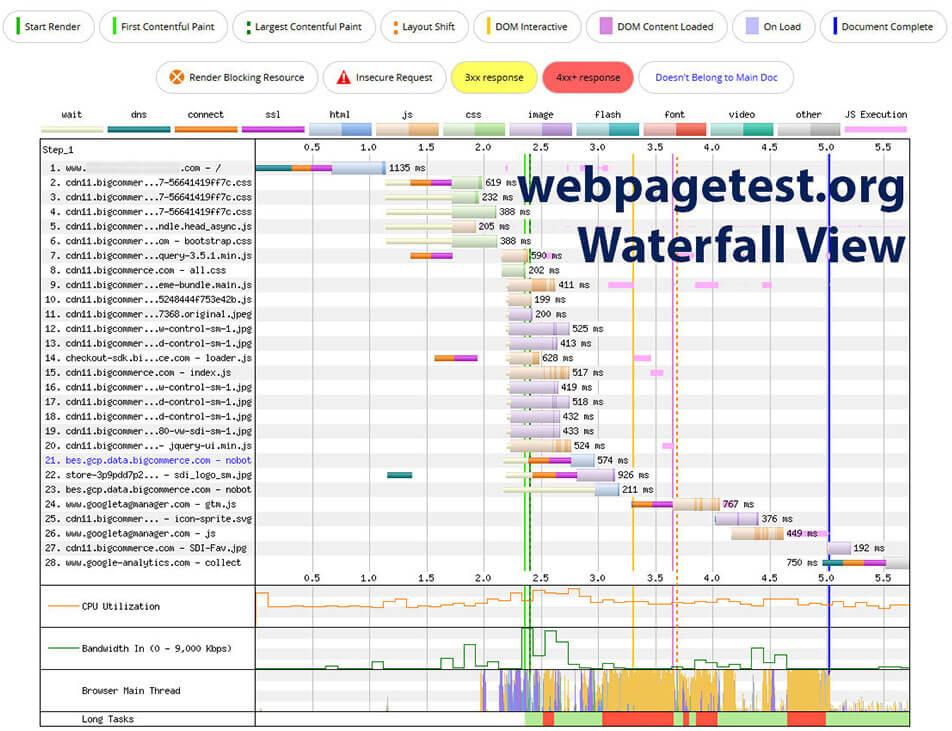
WebPageTest
It is an open-source web performance testing tool designed to provide diagnostic information of web page performance under different conditions. Its online version facilitates to run each test from different locations on real browsers in customized network conditions. It helps you test the user’s real experience over modern devices and the latest browser versions. It provides website technical performance measurements by scaling the user’s visual experience. The provided metrics about DNS, TCP, TLS, and other analysis attributes help you improve website performance. The key website performance attributes in WebPageTest Waterfall View chart are- Key; Request list, Request timeline, CPU Utilization, Bandwidth In, Browser Main Thread, etc.
Conclusion
In conclusion, employing a waterfall analysis is a powerful approach to accelerate your website’s performance. By meticulously dissecting the loading process, you can identify bottlenecks, prioritize optimizations, and enhance user experience. Begin by scrutinizing each stage of the waterfall chart—DNS resolution, connection establishment, data transfer, and rendering. Prioritize efficient hosting, leverage browser caching, and implement content delivery networks (CDNs). Optimize resource sizes, defer non-essential scripts, and adopt compression techniques. Continuously monitor and refine your strategies, considering the evolving best practices. Waterfall analysis provides a comprehensive roadmap to streamline loading times, ultimately resulting in a faster, more engaging website for your users.
FAQs
Document Object Model (DOM) is a programming interface for XML and HTML documents that provides a node tree-structured view of a document defining different ways to access and manipulate it using JavaScript like scripting languages. All items in the DOM are called nodes. There are three main types of DOM nodes:
* Element
* Text
* Comment
A node tree represents an HTML element. Chrome DevTools show a DOM after being manipulated by JavaScript or HTML. A DOM is separated into three parts:
* Core DOM – A standard model for all the document types
* HTML DOM – A standard model for the HTML documents
* XML DOM- A standard model for the XML documents
To analyze the website speed, you need to consider the elements that might be blocking the DOM resulting in an increase in page load time. These elements are known as render blocking resources also like CSS, and JavaScript.
You can use PageSpeed Insights or Chrome DevTools (Chrome Canary). The following example is created with Chrome Canary:
1. Launch Google Chrome developers tools
2. Windows: F12 or also Ctrl + Shift + I
3. Browse the “Network” panel
4. Refresh the page by using Ctrl + R (Cmd + R)
5. You will see a waterfall chart with load times for different attributes.
Leave a Reply
Want to join the discussion?Feel free to contribute!